
Merger
"I propose that matchmaking should be approached like a corporate business venture. It can be risky, but I have discovered that the potential profits from acquisitions and mergers cannot be underestimated" ~ Robert Rinder
Mergers have become a viable tool for restructuring companies, improving service delivery and efficiency and ultimately improving customer base. Mergers can be challenging because staffs from different backgrounds and companies with varying mission come together. Therefore, it is important to do a detailed analysis before a decision to merger is done.
Background:
A company (company A) is planning a merger with another company (company B). The CEO of Company A is looking forward to a smooth transition and so after multiple rounds of discussion. They have decided to do audit of the business Infrastructure of Company B. I as the data analyst is called to audit the business and analyze their data for the company to decide if the merger is worth it.
Deliverables
The data collected and received was for customer, product, metric, region and sales information and deliverables for the project include a report on:
-
Total Sales, total quantity profit and profit margin
-
A comparison of the performance and performance last year
-
Moving average in terms of profit & sales
-
Show the sales comparison between Cumulative Performance vs Cumulative Performance last year
-
Top Performer in terms of Product and Customer
-
Performance in terms of region sales
Data Cleaning
The data provided by company B was in an excel sheet with 5 different sheets containing customer information, metric selection, product information, regions and sales information. Each sheet was loaded into power BI using power query and various process of data cleaning was carried out such as:
-
Removing duplicate wows
-
Removing blank cells
-
Using the find and replace to ensure that the cells have uniform information
-
Each column was set to the right data type
Data Modelling
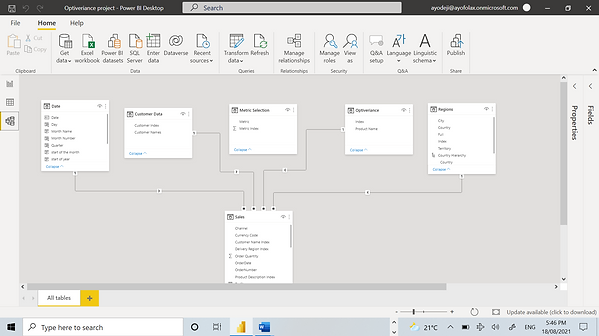
The star modelling technique was used to model the data and tables were connected to each other using one-to-many relationships to connect each attribute.
FINDINGS
Based on the project requirements, the following findings can be found:
Key Performance Index (KPIs)
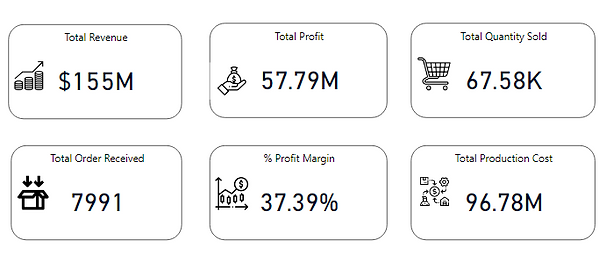
Using various Data Analysis Xpression (DAX) formulas, the total revenue, profit, quantity sold, orders received, %profit margin and total production cost were determined between July 2014 and December 2016.
Performance Comparison

Comparison of the Revenue, Production cost and Profit across sales period

Comparison of the Revenue, Production cost and Profit across sales period
Other Indicators

Total profit with a 12-months moving average to show overall general trend of profit
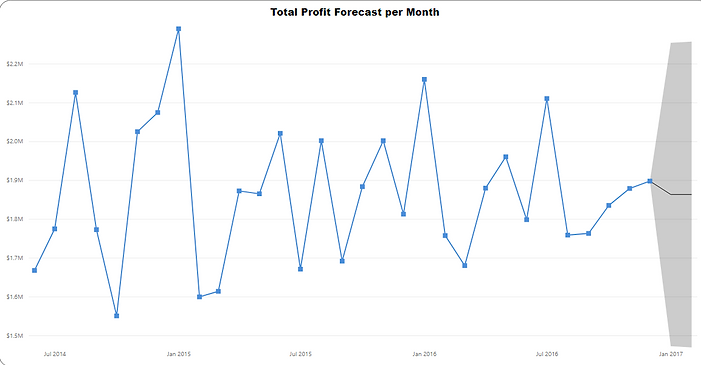
Profit forecast for the next two months

Revenue by region. (the circle size gives an indication of the revenue generated)
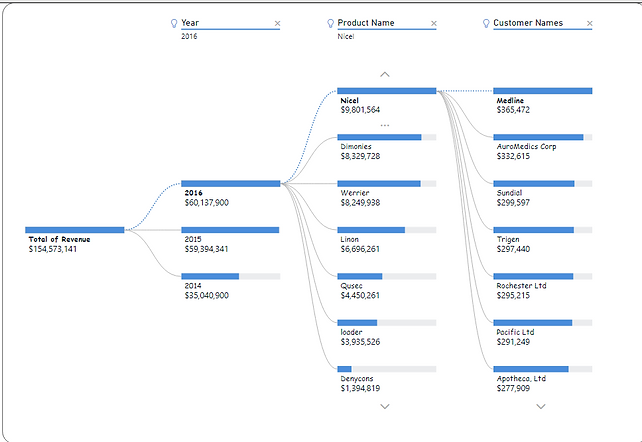
Revenue by year, product and customer
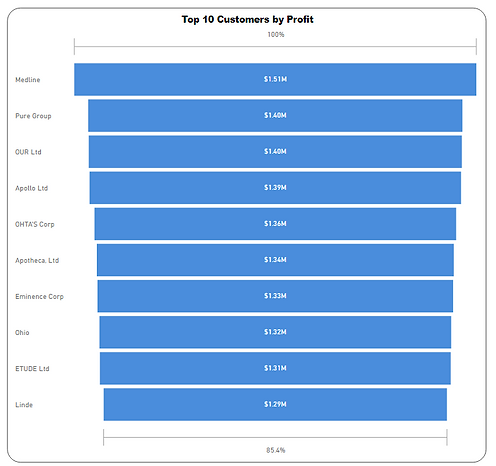
Comparison of the Revenue, Production cost and Profit across sales period
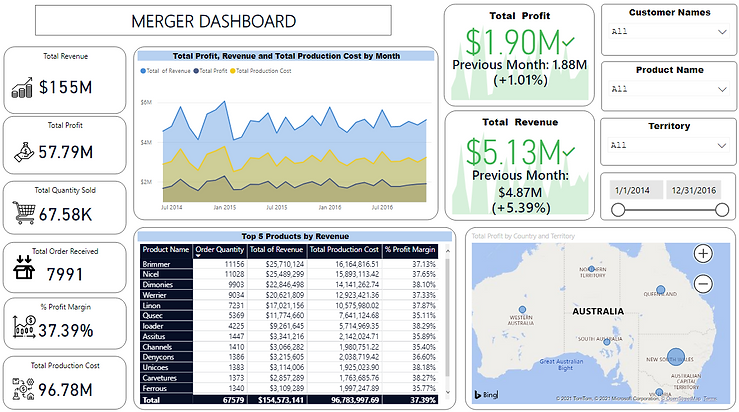
Dashboard Page 1
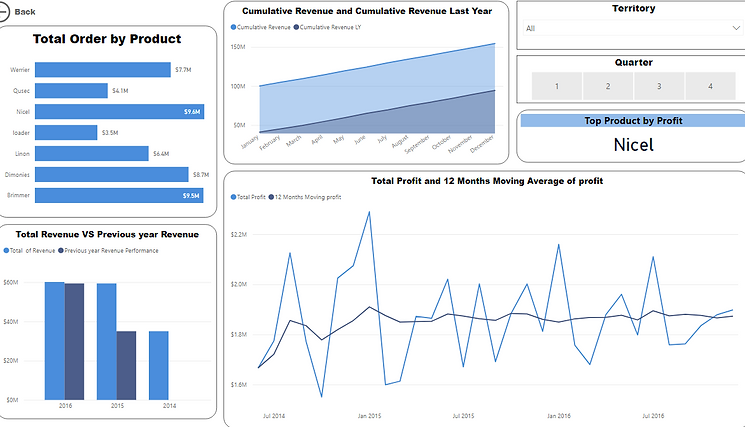
Dashboard Page 2
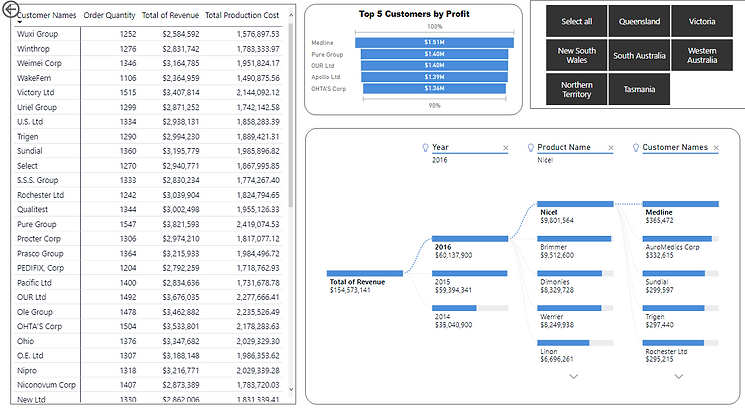
Dashboard Page 3
Conclusion
In conclusion, the following conclusions can be drawn from the analysis:
-
The month of January seems to have high orders which also led to higher revenue. It is important to pay attention to this month
-
New South Wales generates the highest revenue for the business
-
Amongst the customers, Medline generated the highest revenue among all the products
-
Brimmer product generated the highest revenue while Carvetures generated the lowest profit.
Contact
I'm always looking for new and exciting opportunities in which i can utilize this skills to better decision making. Let's connect.